How do I correctly profile Entity Framework?
What is the minimal amount of code I can write to get a single callback from EF 4.1 that provides the following:
OnSQLExecuted(DbCommand cmd, DateTime start, double durationMS, string stacktrace)
At the moment we use a nasty hack that seems to be leaking performance, I am curious at how we can achieve this callback with a minimal amount of impact on the app.
We are able to wire this up in Mini Profiler by hacking around - intially we changed Database.DefaultConnectionFactory however mucking with the default factory means you can not have two profiling factories going at the same time. So we went the more aggressive route.
The technique commonly used is pretty straight forward, you implement: DbProviderFactory, IDbConnectionFactory, DbProviderServices, DbConnection, DbCommand and DbDataReader in such a way that they intercept the calls and profile.
So far, easy... however it gets messy when you try to wire this up:
   try
    {
        // ensure all the factories are loaded
        DbProviderFactories.GetFactory("...");
    }
    catch (ArgumentException)
    {
    }

    Type type = typeof(DbProviderFactories);

    DataTable table;
    // SUPER UGLY - Can this be done in another way?
    object setOrTable = (type.GetField("_configTable", BindingFlags.NonPublic | BindingFlags.Static) ??
                    type.GetField("_providerTable", BindingFlags.NonPublic | BindingFlags.Static)).GetValue(null);
    if (setOrTable is DataSet)
    {
        table = ((DataSet)setOrTable).Tables["DbProviderFactories"];
    }

    table = (DataTable)setOrTable;

    foreach (DataRow row in table.Rows.Cast<DataRow>().ToList())
    {
        DbProviderFactory factory;
        try
        {
            factory = DbProviderFactories.GetFactory(row);
        }
        catch (Exception)
        {
            continue;
        }

        var profType = typeof(MvcMiniProfiler.Data.EFProfiledDbProviderFactory<>).MakeGenericType(factory.GetType());


        DataRow profiled = table.NewRow();
        profiled["Name"] = row["Name"];
        profiled["Description"] = row["Description"];
        profiled["InvariantName"] = row["InvariantName"];
        profiled["AssemblyQualifiedName"] = profType.AssemblyQualifiedName;
        table.Rows.Remove(row);
        table.Rows.Add(profiled);

    }
It requires some reflection hacks and totally bombs on the latest version of EF:
FileLoadException: The given assembly name or codebase was invalid. (Exception from HRESULT: 0x80131047)
This was documented by both Frans and Ayende.
How do I wire up my profiling factories and family in a robust and elegant way?
Is there any other way to get my callback?
4 Answers
The easiest way is to use the Entity Framework tracing wrappers and hook into the EFTracingConnection's CommandFinished. It doesn't give you the start time, but it does give you the duration (which, subtracted from Now, is likely close enough).
I'd call the code impact "moderate", since you do have to change references to the existing context class. It's pretty straightforward, though.
If you just want tracing and don't need the actual callback, the NuGet package has a simple default tracing system.
Edit (stack trace added): The EF tracing wrappers don't give you the stack trace. You can get the source and add it without too much difficulty, but I'd think that would impact performance.
While it's a commercial product I would also strongly recommend looking at EF Prof. This tool has been developed by Ayende (Oren Eini spelling?) who has also made NH Prof, Uber Prof (NH + EF Prof) and RavenDB among other products.
Having purchased his NH Prof, when tuning NH it was invaluable and I would expect EF Prof would be just as valuable respectively.
First: If you are looking for the custom implementation where you can trigger your own event directly in EF forget about it. ADO.NET team somehow forgot to implement any extension points and they even forgot to implement any logging (except converting ObjectQuery / DbQuery to SQL but it doesn't handle lazy loading or data modifications).
I believe every tracing implementation used with EF is done by creating custom DbProviderFactory which wraps real factory and wraps real Connection, Command, etc. That is very clearly described in mentioned tracing wrappers.
There are to commercial tools which already do what you want
- Mentioned EF Prof is great tool but it cost $300 per seat.
- Alternative is Huagati Query Profiler. Especially this screen shot looks like what you are looking for. The price is much lower ($40 per seat) and it supports Linq-to-sql, Entity Framework and LLBLGen.
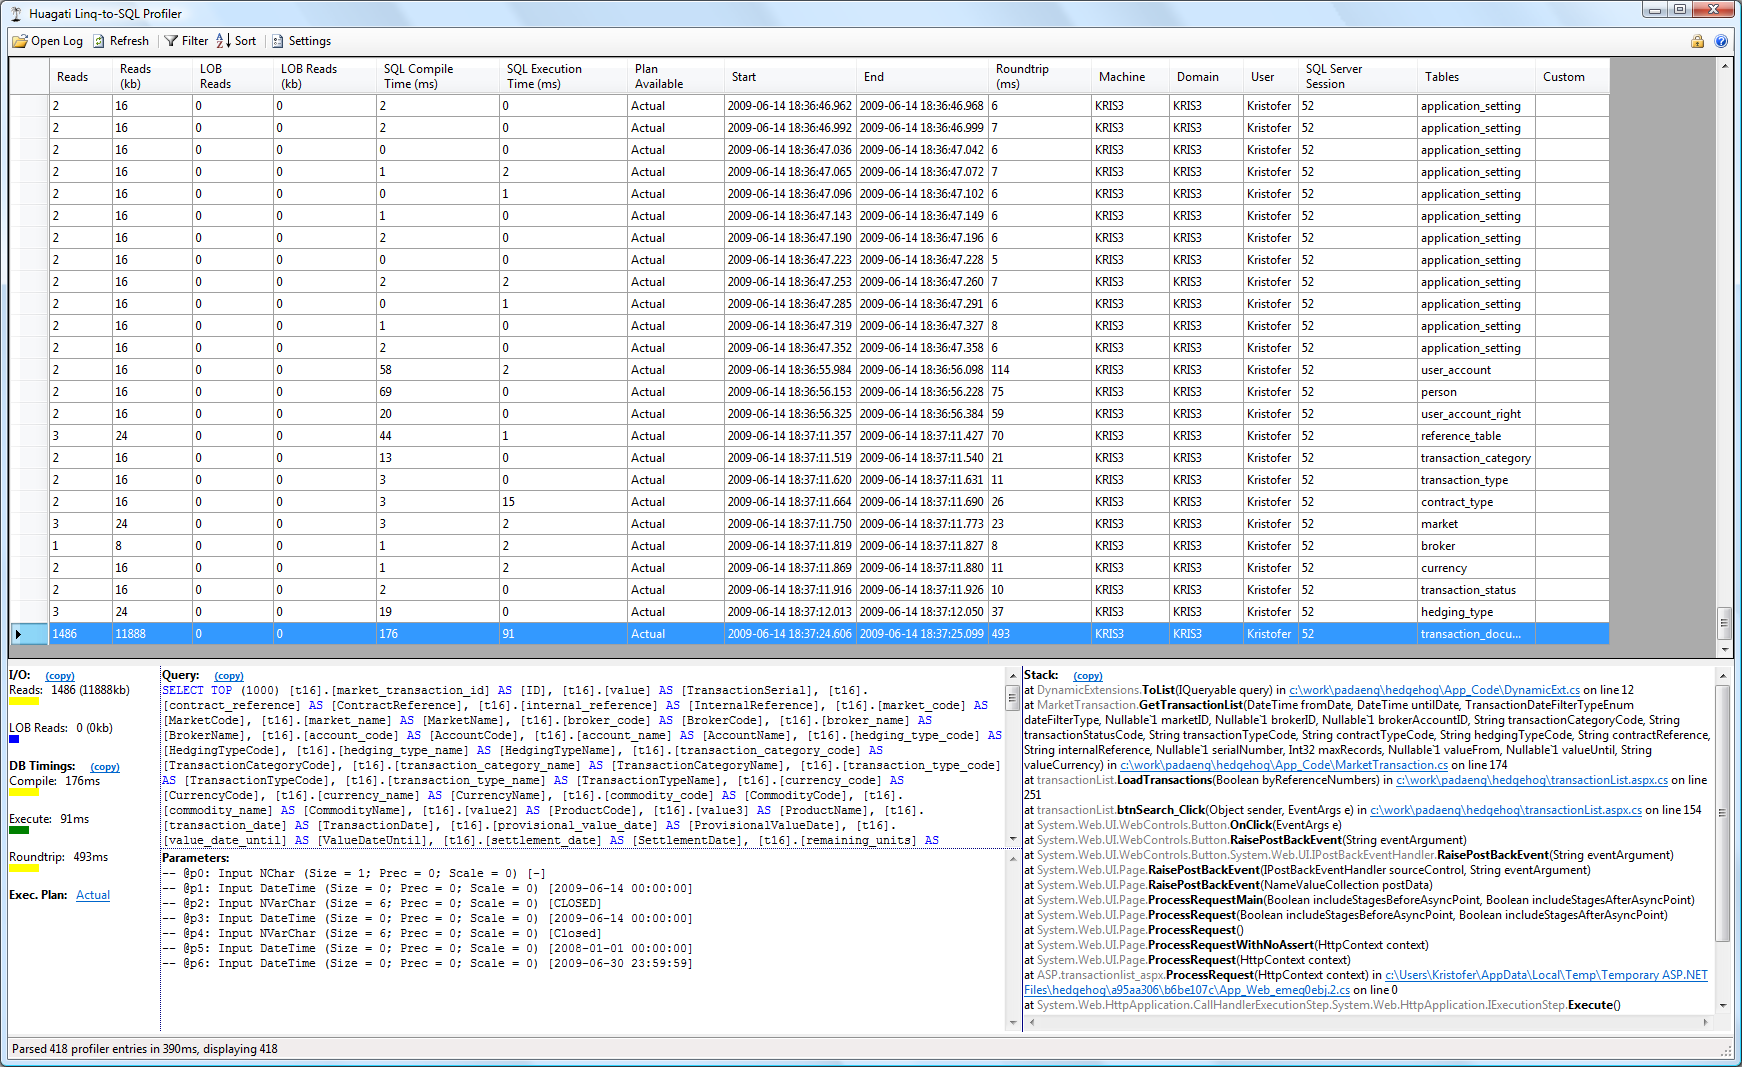
Both tools have free trial so you can download them and try them.
Btw. perhaps you can get a lot of information you are looking for from Intelli Trace if you have VS 2010 Ultimate. You can read about all currently available alternatives in MSDN Magazine.
I think there is one big question mark - are you using DbContext or ObjectContext (you mentioned EFv4.1)? Mentioned tools and tracing wrappers were created for ObjectContext API so I'm not sure how they work with DbContext API. You can still get ObjectContext from DbContext but if the tool expect EntityConnection instead of common connection it will be a problem.
I can recommend Entity Framework Profiler and Monthly subscription is suitable for you need with minimum cost $16 US per monthly. We had some performance issues with DbContext and it provided good visual information to fix those. you can integrate EF profiler with your continuous integration server and keep improve your performance.
User contributions licensed under CC BY-SA 3.0